
Since the 18th CPC National Congress, under the strong leadership of the Party Central Committee with Comrade Xi Jinping at its core, China has adhered to the people-centered philosophy, improved people’s livelihoods, and achieved the strategic goal of building a well-off society. Thanks to a series of policies and measures in the field of livelihoods, residents' income has grown faster with an improved structure; income gap between urban and rural areas has constantly narrowed, resulting in steady increase in consumption and better quality of life.
I. Rapid increase of resident's income with an optimized structure
Since the 18th Party Congress, China has intensified its supportive measures for employment expansion and income growth, and residents have shared more dividends from the country’s socio-economic progress, harvesting faster growth of incomes with a more reasonable structure.

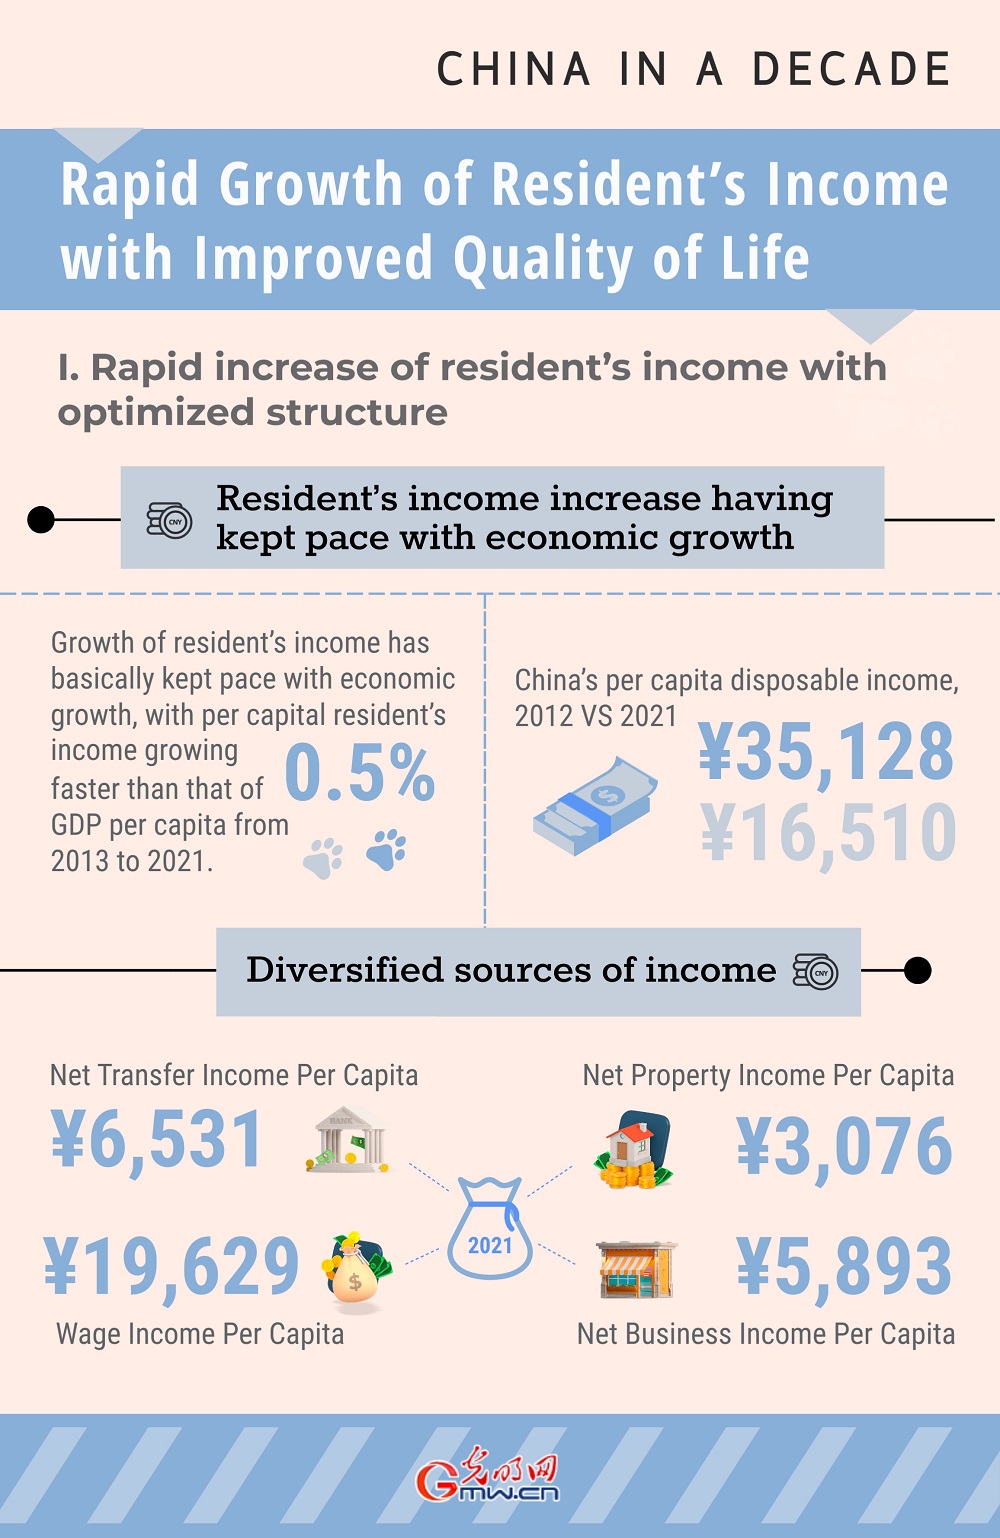
1. Residents' income increase has kept pace with economic growth
In 2021, China's per capita disposable income reached 35,128 yuan, an increase of 18,618 yuan from the 16,510 yuan in 2012, with a cumulative nominal growth of 112.8% and an average annual nominal growth of 8.8%, and a cumulative real growth of 78.0% and an annual real growth of 6.6% after deducting the price factor. Growth of residents' income has basically kept pace with economic growth, with per capita disposable income growing at 0.5 percentage points faster than that of GDP per capita from 2013 to 2021.
2. Diversified sources of income with rising proportion of net transfer income and net property income
In 2021, per capita net transfer income reached 6,531 yuan, an increase of 139.4% over 2012 with an average annual growth of 10.2%, accounting for 18.6% of disposable income per capita in 2021, up from 16.5% in 2012; net property income per capita reached 3,076 yuan in 2021, up 149.8% over 2012 with an average annual growth of 10.7%, and its proportion in disposable income per capita increased from 7.5% in 2012 to 8.8% in 2021. Residents' wage income and net business income kept a fast pace of growth. In 2021, wage income per capita reached 19,629 yuan, up 109.3% over 2012 with an average annual growth of 8.6%; residents' per capita net business income hit 5,893 yuan, up 85.8% over 2012 with an average annual growth of 7.1%.
II. Optimized income distribution with narrowing income gaps
Since the 18th Party Congress, China has attached great importance to income distribution, and made efforts to deepen the reform of the income distribution system, the urban-rural income gap has continued to narrow with an improved distribution pattern.

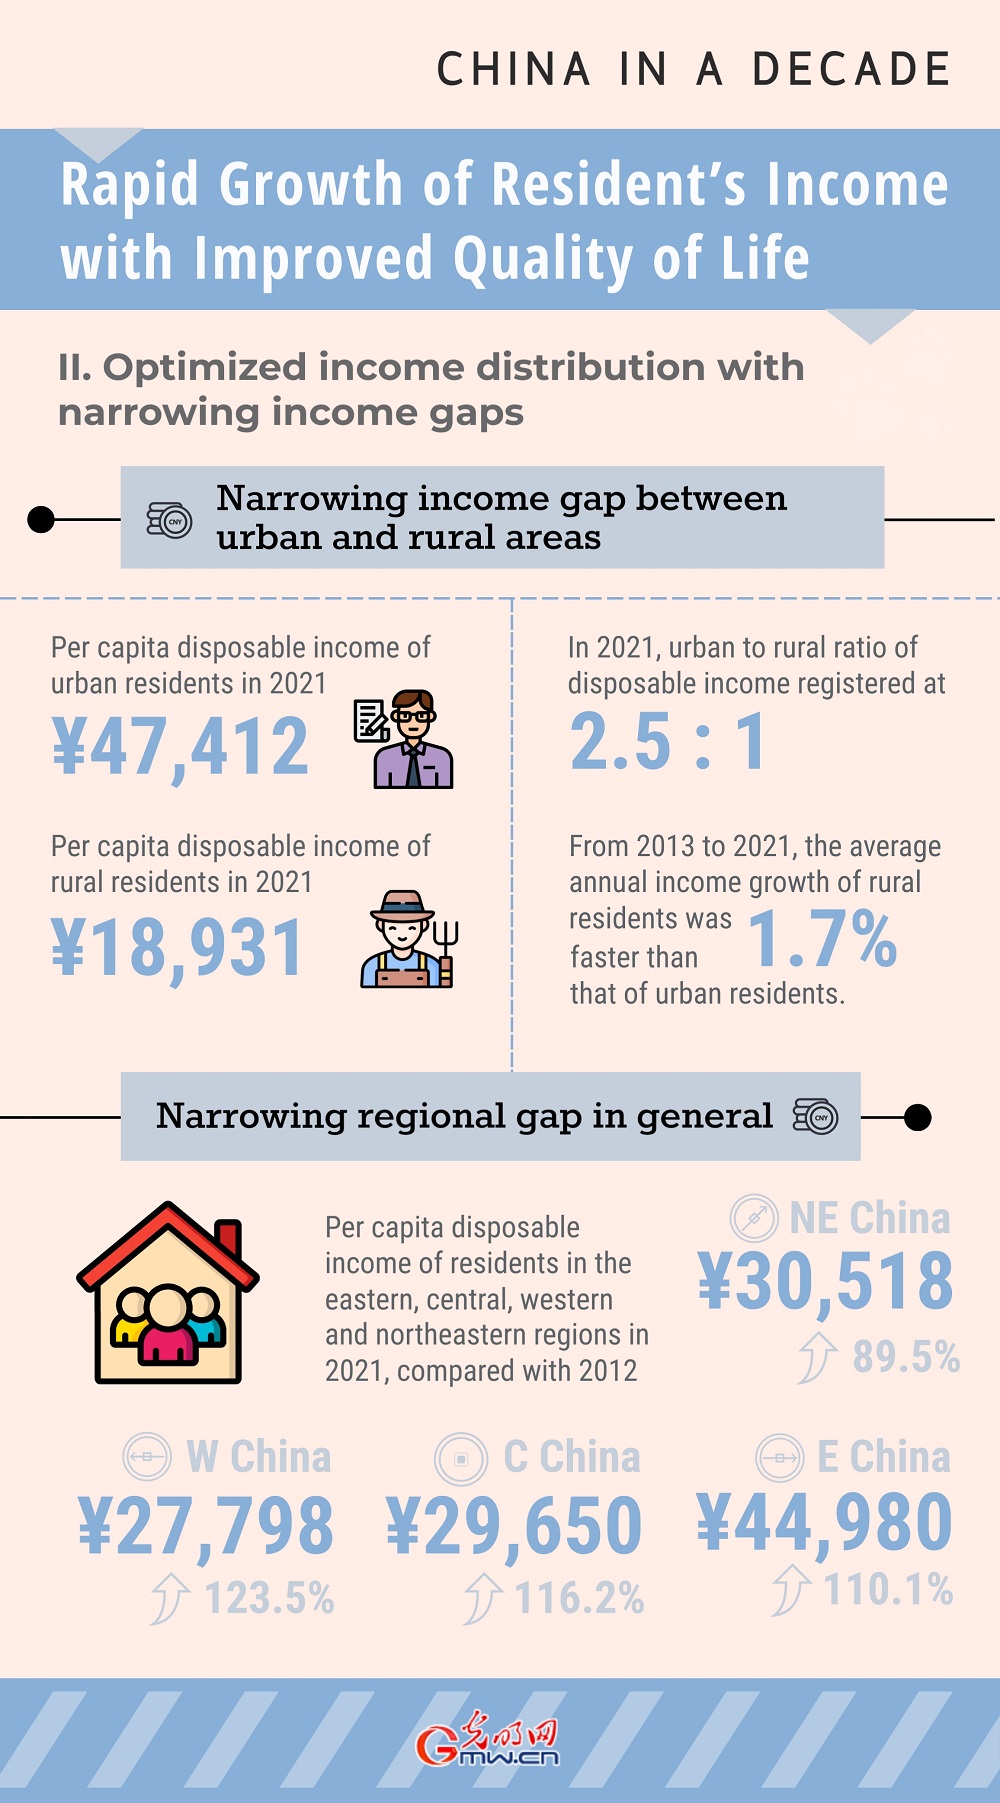
1. The gap between urban and rural areas continues to narrow, and the income ratio decreases year by year
In 2021, per capita disposable income of urban residents reached 47,412 yuan, an increase of 96.5% over 2012; per capita disposable income of rural residents reached 18,931 yuan, an increase of 125.7% over 2012. From 2013 to 2021, the average annual income growth of rural residents was 1.7 percentage points faster than that of urban residents. In 2021, the urban to rural ratio registered at 2.5:1 in disposable income, down 0.38 from 2012, and the gap narrowed continuously.
2. Faster growth of resident's income in the central and western region with a narrowing regional gap in general
In 2021, per capita disposable income of residents in the eastern, central, western and northeastern regions reached 44,980, 29,650, 27,798 and 30,518 yuan respectively, with a cumulative increase of 110.1%, 116.2%, 123.5% and 89.5% compared with 2012.
III. Rising consumption with an optimized consumption structure
Since the 18th Party Congress, China has introduced a number of measures to expand consumption and continued to improve the market environment to drive consumption increase and structural upgrading.

1. Greater consumption ability
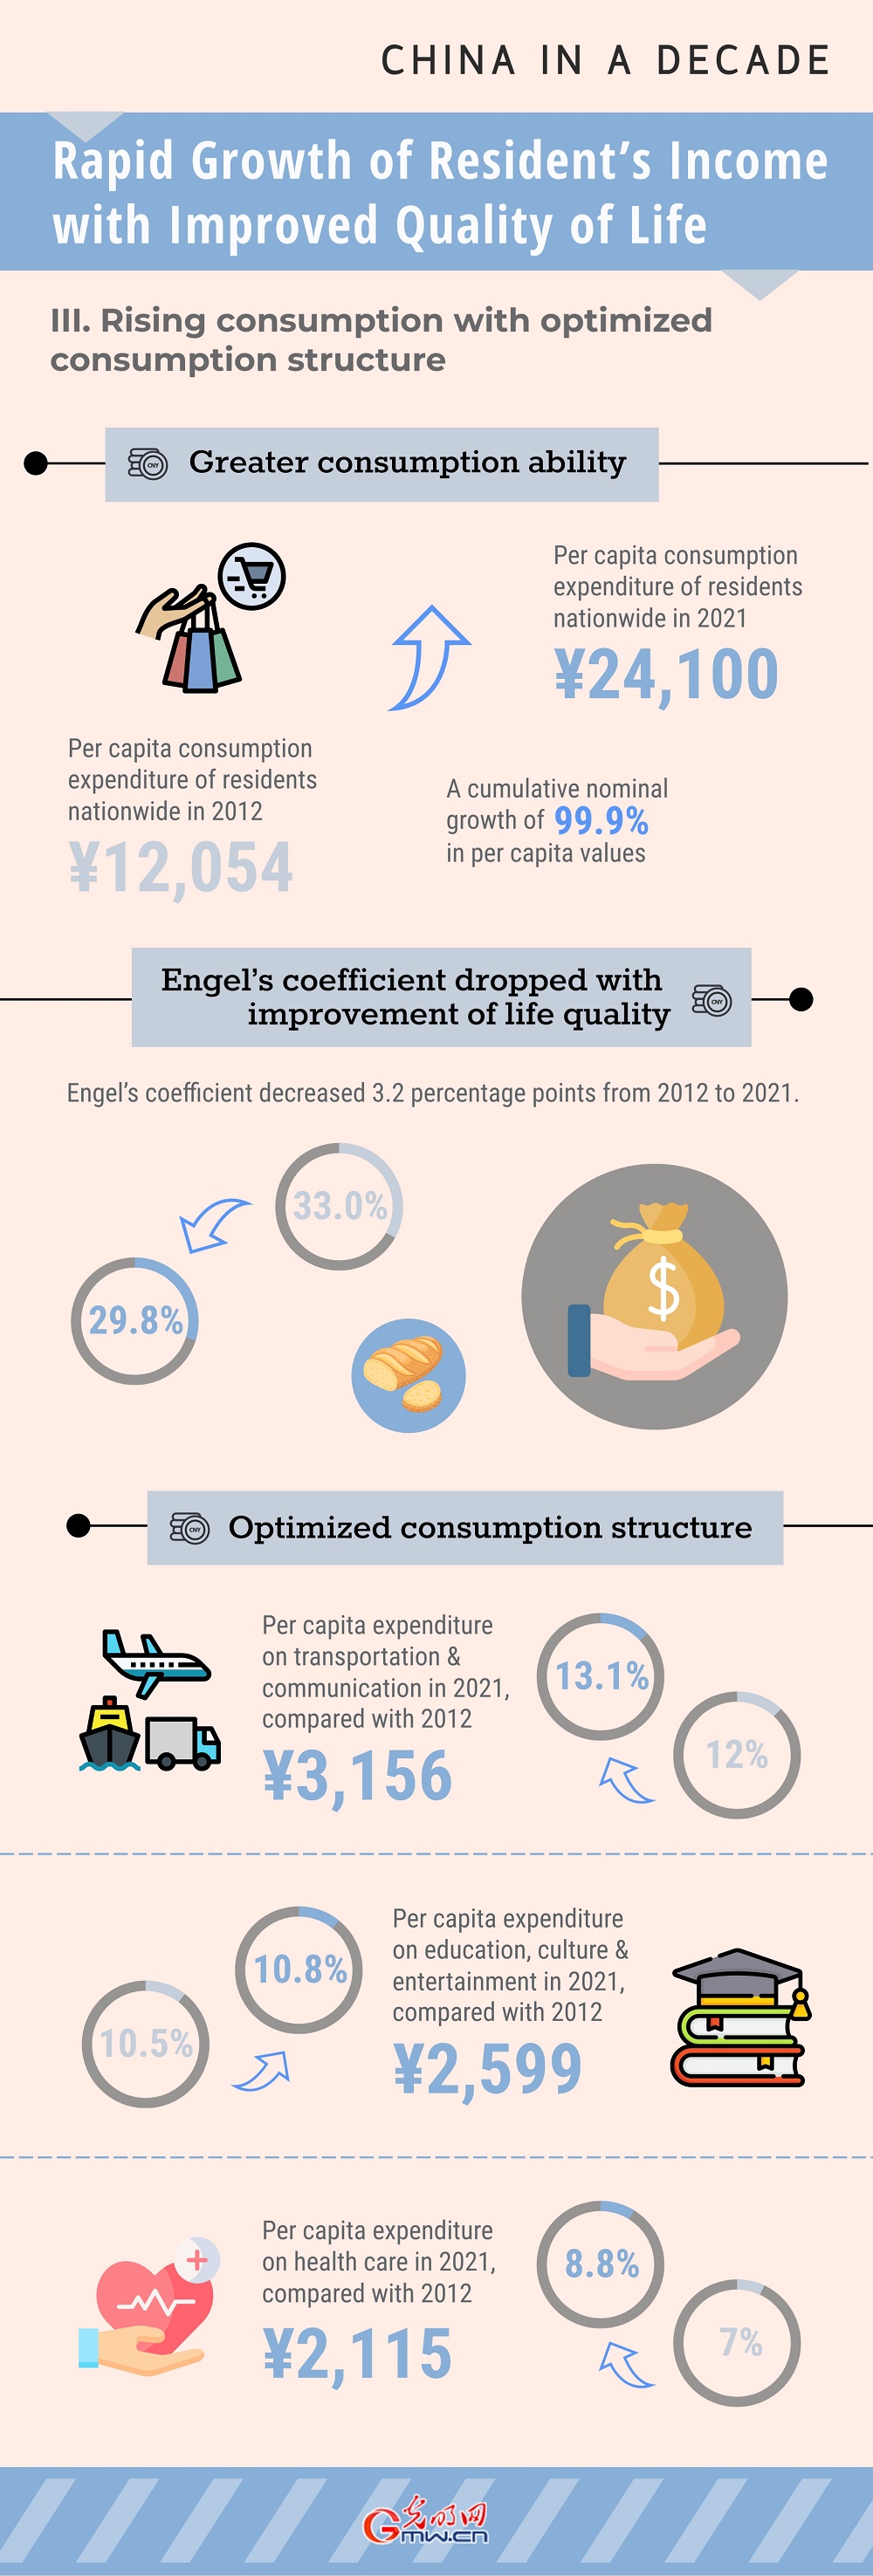
In 2021, per capita consumption expenditure of residents nationwide reached 24,100 yuan, up 12,046 yuan from 12,054 yuan in 2012, with a cumulative nominal growth of 99.9% in per capita values and an average annual nominal growth of 8.0%, and a cumulative real growth of 67.4% and an annual real growth of 5.9% after deducting price factors.
2. Engel's coefficient dropped with improvement of life quality
In 2021, national per capita spending on food, tobacco and alcohol reached 7,178 yuan, an increase of 80.2% over 2012 with an average annual growth of 6.8%. The proportion of spending on food, tobacco and alcohol in overall consumption expenditure (Engel's coefficient) decreased from 33.0% in 2012 to 29.8% in 2021, down 3.2 percentage points.
3. Optimized consumption structure with development-oriented and enjoyment-oriented consumption on the rise
National per capita expenditure on transportation and telecommunications in 2021 reached 3,156 yuan, accounting for 13.1% of total per capita annual consumption, up 1.1 percentage points from 2012. Per capita expenditure on education, culture and entertainment in 2021 reached 2,599 yuan, accounting for 10.8% of total per capita annual consumption, up 0.3 percentage points from 2012. In 2021, per capita expenditure on health care reached 2,115 yuan, accounting for 8.8% of the annual total, up 1.8 percentage points from 2012. Per capita expenditure on services in 2021 accounted for 44.2% of the annual total, 4.5 percentage points higher than that in 2013.
IV. Higher quality of life with improved living environment
Since the 18th Party Congress, driven by residents' rising incomes and spendings, durable household consumer goods have constantly upgraded. At the same time, because of better infrastructures across the country, basic public services and facilities have covered a much larger population, and the living environment has been greatly improved for all residents.

1. Continuous upgrading of durable consumer goods
In 2021, every 100 urban and rural households owned 50.1 and 30.2 cars, respectively, 132.7% and 358.3% higher than in 2012. Every 100 urban and rural families owned 161.7 and 89.0 air conditioners, 27.5% and 250.8% higher than in 2012, respectively. The number of cell phones owned by every 100 households in the urban and rural areas reached 253.6 and 266.6, respectively, up 19.3% and 34.8% over 2012.
2. Significant improvement in housing conditions and quality
In 2021, the proportion of residents living in concrete or brick-concrete buildings reached 96.2% and 77.6% for urban and rural areas respectively, 4.4 and 21.9 percentage points higher than in 2013. The proportion of urban and rural residents with safe drinking water reached 99.5% and 97.0%, up 1.5 and 22.3 percentage points respectively from 2013. In 2021, the proportion of urban and rural residents using sanitary toilets reached 97.6% and 82.6%, 8.3 and 47.0 percentage points higher than in 2013, respectively.
3. Continuous improvement of living environment and quality of life
The coverage of water, electricity, road, and telecommunications services has continued its expansion. As of 2021, all residential communities with electricity had been covered by the aforementioned basic services. In 2021, 96.6% of urban residential communities were drinking water after centralized purification, and 80.4% of villages had centralized drinking water purification treatment, 5.3 and 34.8 percentage points higher than in 2013, respectively. In 2021, 99.1% of residential communities in urban areas had centralized disposal of garbage, up 3.3 percentage points than in 2013; 95.2% of villages practiced centralized disposal of garbage, 46.5 percentage points higher than in 2013.
4. Better medical and education services
In 2021, 87.5% urban residential communities and 94.8% of villages were equipped with a healthcare station, up 7.8 and 13.2 percentage points over 2013, respectively. In 2021, 99.0% urban families had kindergartens or preschools right in their community, 2.3 percentage points higher than in 2013; 90.1% of rural households could send their kids to kindergartens or preschools right in the village, 14.4 percentage points higher than in 2013. In 2021, 99.2% of urban families were located in communities where their kids can conveniently attend elementary school, 2.4 percentage points higher than in 2013; 91.3% of households in rural areas were living in villages where kids can conveniently attend elementary school, 10.5 percentage points higher than in 2013.

Wuyi rock pigment painting in China's Fujian infuses modern artistic elements into tradition

China-Serbia digital art exhibition explores time, space, heritage


Exhibition of children's arts opens in southwest China's Chongqing

World's largest ice and snow theme park opens, igniting China's winter tourism fever
点击右上角![]() 微信好友
微信好友
 朋友圈
朋友圈

请使用浏览器分享功能进行分享
